I am going to perform neural network classification in this tutorial. I am using a generated data set with spirals, the code to generate the data set is included in the tutorial. I am going to train and evaluate two neural network models in Python, an MLP Classifier from scikit-learn and a custom model created with keras functional API.
A neural network tries to depict an animal brain, it has connected nodes in three or more layers. A neural network includes weights, a score function and a loss function. A neural network learns in a feedback loop, it adjusts its weights based on the results from the score function and the loss function. A simple neural network includes three layers, an input layer, a hidden layer and an output layer. More than 3 layers is often referred to as deep learning.
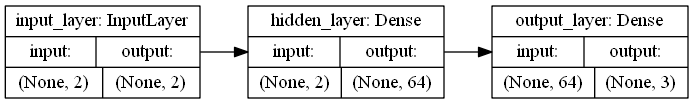
Keras functional API can be used to build very complex deep learning models with multiple layers, the image above is a plot of the model used in this tutorial. I takes a 2 dimensional array as input (x,y), the input layer is connected to a hidden layer with 64 nodes (you can test with more and less) and the output layer make predictions for 3 classes. Each class is assigned a probability, and I select the class with the highest probability as my prediction.
Data set and libraries
I generate a data set with three spirals by using the code below, it is a non-linear data set that a linear classifier has difficulties to learn. I save the data set to a .csv file. You need to install Graphviz if you want to plot a model like the one above, you also need to add a path to its binaries as environment variables. I am using the following libraries: pandas, joblib, numpy, matplotlib, keras, tensorflow (tensorflow-gpu) and scikit-learn.
import numpy
import pandas
import matplotlib.pyplot as plt

# Generate a data set with spirals
# http://cs231n.github.io/neural-networks-case-study/
def generate_spirals():

    N = 400 # number of points per class
    D = 2 # dimensionality
    K = 3 # number of classes
    data = numpy.zeros((N*K,D)) # data matrix (each row = single example)
    labels = numpy.zeros(N*K, dtype='uint8') # class labels
    for j in range(K):
      ix = range(N*j,N*(j+1))
      r = numpy.linspace(0.0,1,N) # radius
      t = numpy.linspace(j*4,(j+1)*4,N) + numpy.random.randn(N)*0.2 # theta
      data[ix] = numpy.c_[r*numpy.sin(t), r*numpy.cos(t)]
      labels[ix] = j

    # Save to a csv file
    f = open('files\\spirals.csv', 'w')
    f.write('x,y,label\n')
    for i in range(len(labels)):
        f.write(str(data[i][0]) + ',' + str(data[i][1]) + ',' + str(labels[i]) + '\n')
    f.close()

# Visualize data set
def visualize_data_set():

    # Load data set
    ds = pandas.read_csv('files\\spirals.csv')

    # Print first 5 rows in data set
    print('--- First 5 rows ---')
    print(ds.head())

    # Print the shape
    print('\n--- Shape of data set ---')
    print(ds.shape)

    # Print class distribution
    print('\n--- Class distribution ---')
    print(ds.groupby('label').size())

    # Visualize data set
    figure = plt.figure(figsize = (12, 8))
    figure.suptitle('Spirals', fontsize=16)
    grouped_dataset = ds.groupby('label')
    labels = ['0', '1', '2']
    for i, group in grouped_dataset:
        plt.scatter(group['x'], group['y'], label=labels[int(i)])
    plt.ylabel('y')
    plt.xlabel('x')
    plt.legend()
    #plt.show()
    plt.savefig('plots\\spirals.png')

# Generate spirals
generate_spirals()

# Visualize data set
visualize_data_set()
Visualize data set
The data set is well balanced by design, it has 1 200 data points and 3 classes (400 per class). A linear classifier would be very bad in classifying this data set as it is impossible to divide data points by lines as you can see in the image below. It is a 33.33 % probabilty (400/1200) to classify a data point correctly and this is our baseline performance, our models need to perform better than this.
--- First 5 rows ---
          x         y  label
0  0.000000  0.000000      0
1 -0.000156  0.002501      0
2 -0.001956  0.004615      0
3  0.000877  0.007468      0
4  0.004620  0.008897      0

--- Shape of data set ---
(1200, 3)

--- Class distribution ---
label
0    400
1    400
2    400
dtype: int64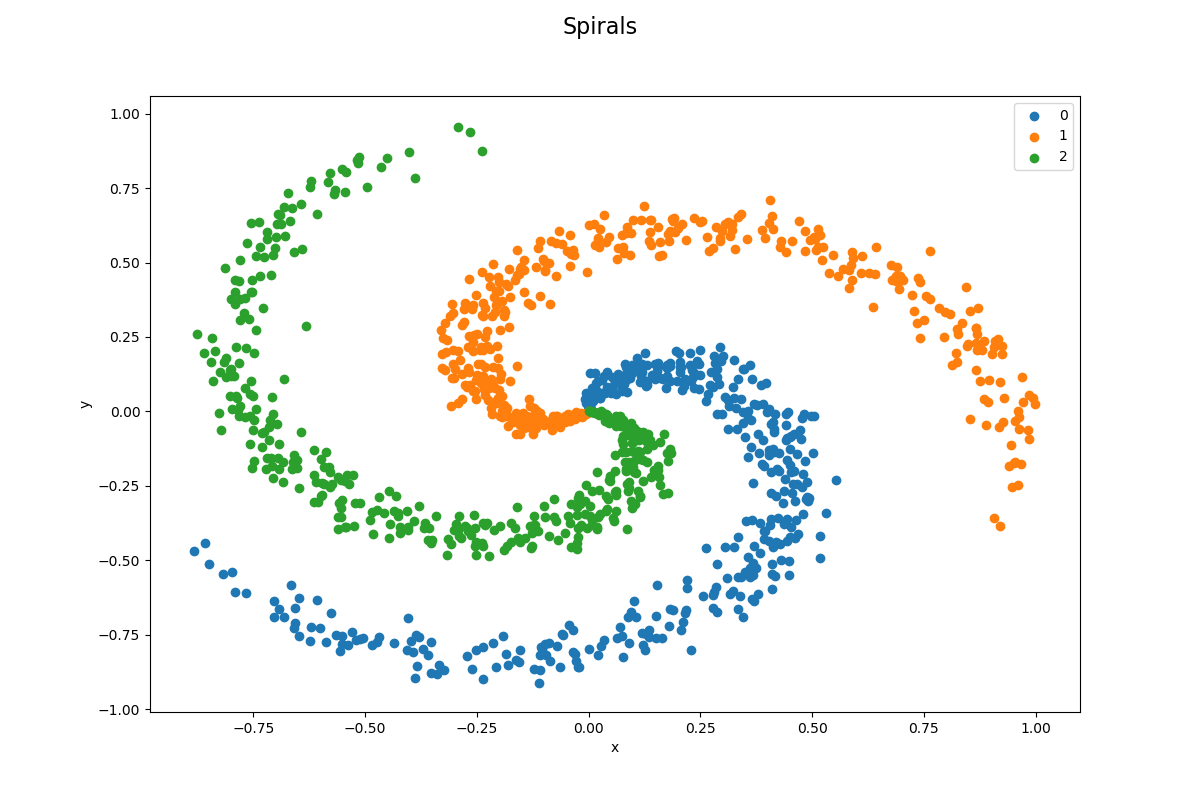
MLP Classifier
MLP Classifier is a neural network classifier in scikit-learn and it has a lot of parameters to fine-tune. I am using default parameters when I train my model. I load the data set, slice it into data and labels and split the set in a training set and a test set. I am making sure that the split will be the same each time by using a random state and I am making sure that sets is balanced after the split. The code and the output from the evaluation process is shown below.
# Import libraries
import pandas
import joblib
import numpy as np
import matplotlib.pyplot as plt
import sklearn.model_selection
import sklearn.metrics
import sklearn.neural_network

# Train and evaluate
def train_and_evaluate(X_train, Y_train, X_test, Y_test):

    # Create a model
    model = sklearn.neural_network.MLPClassifier(hidden_layer_sizes=(100, ), activation='relu', solver='adam',
                                                 alpha=0.0001, batch_size='auto', learning_rate='constant', learning_rate_init=0.001, power_t=0.5,
                                                 max_iter=1000, shuffle=True, random_state=None, tol=0.0001, verbose=False, warm_start=False, momentum=0.9,
                                                 nesterovs_momentum=True, early_stopping=False, validation_fraction=0.1, beta_1=0.9, beta_2=0.999, epsilon=1e-08,
                                                 n_iter_no_change=10)

    # Train the model on the whole data set
    model.fit(X_train, Y_train)

    # Save the model (Make sure that the folder exists)
    joblib.dump(model, 'models\\mlp_classifier.jbl')

    # Evaluate on training data
    print('\n-- Training data --')
    predictions = model.predict(X_train)
    accuracy = sklearn.metrics.accuracy_score(Y_train, predictions)
    print('Accuracy: {0:.2f}'.format(accuracy * 100.0))
    print('Classification Report:')
    print(sklearn.metrics.classification_report(Y_train, predictions))
    print('Confusion Matrix:')
    print(sklearn.metrics.confusion_matrix(Y_train, predictions))
    print('')

    # Evaluate on test data
    print('\n---- Test data ----')
    predictions = model.predict(X_test)
    accuracy = sklearn.metrics.accuracy_score(Y_test, predictions)
    print('Accuracy: {0:.2f}'.format(accuracy * 100.0))
    print('Classification Report:')
    print(sklearn.metrics.classification_report(Y_test, predictions))
    print('Confusion Matrix:')
    print(sklearn.metrics.confusion_matrix(Y_test, predictions))

# Plot the classifier
def plot_classifier(X, Y):

    # Load the model
    model = joblib.load('models\\mlp_classifier.jbl')

    # Calculate
    h = 0.02
    x_min, x_max = X[:, 0].min() - 1, X[:, 0].max() + 1
    y_min, y_max = X[:, 1].min() - 1, X[:, 1].max() + 1
    xx, yy = np.meshgrid(np.arange(x_min, x_max, h), np.arange(y_min, y_max, h))

    # Make predictions
    Z = model.predict(np.c_[xx.ravel(), yy.ravel()])
    Z = Z.reshape(xx.shape)

    # Plot diagram
    fig = plt.figure(figsize = (12, 8))
    plt.contourf(xx, yy, Z, cmap='ocean', alpha=0.25)
    plt.contour(xx, yy, Z, colors='w', linewidths=0.4)
    plt.scatter(X[:, 0], X[:, 1], c=Y, s=40, cmap='Spectral')
    plt.xlim(xx.min(), xx.max())
    plt.ylim(yy.min(), yy.max())
    plt.savefig('plots\\mlp_classifier.png')

# The main entry point for this module
def main():

    # Load data set (includes header values)
    dataset = pandas.read_csv('files\\spirals.csv')

    # Slice data set in data and labels (2D-array)
    X = dataset.values[:,0:2] # Data
    Y = dataset.values[:,2].astype(int) # Labels

    # Split data set in train and test (use random state to get the same split every time, and stratify to keep balance)
    X_train, X_test, Y_train, Y_test = sklearn.model_selection.train_test_split(X, Y, test_size=0.2, random_state=5, stratify=Y)

    # Make sure that data still is balanced
    print('\n--- Class balance ---')
    print(np.unique(Y_train, return_counts=True))
    print(np.unique(Y_test, return_counts=True))

    # Train and evaluate
    train_and_evaluate(X_train, Y_train, X_test, Y_test)

    # Plot classifier
    plot_classifier(X, Y)

# Tell python to run main method
if __name__ == "__main__": main()
--- Class balance ---
(array([0, 1, 2]), array([320, 320, 320], dtype=int64))
(array([0, 1, 2]), array([80, 80, 80], dtype=int64))
-- Training data --
Accuracy: 99.38
Classification Report:
precision recall f1-score support
0 1.00 0.98 0.99 320
1 0.99 1.00 0.99 320
2 0.99 1.00 1.00 320
accuracy 0.99 960
macro avg 0.99 0.99 0.99 960
weighted avg 0.99 0.99 0.99 960
Confusion Matrix:
[[315 4 1]
[ 0 319 1]
[ 0 0 320]]
---- Test data ----
Accuracy: 99.17
Classification Report:
precision recall f1-score support
0 1.00 0.99 0.99 80
1 0.98 1.00 0.99 80
2 1.00 0.99 0.99 80
accuracy 0.99 240
macro avg 0.99 0.99 0.99 240
weighted avg 0.99 0.99 0.99 240
Confusion Matrix:
[[79 1 0]
[ 0 80 0]
[ 0 1 79]]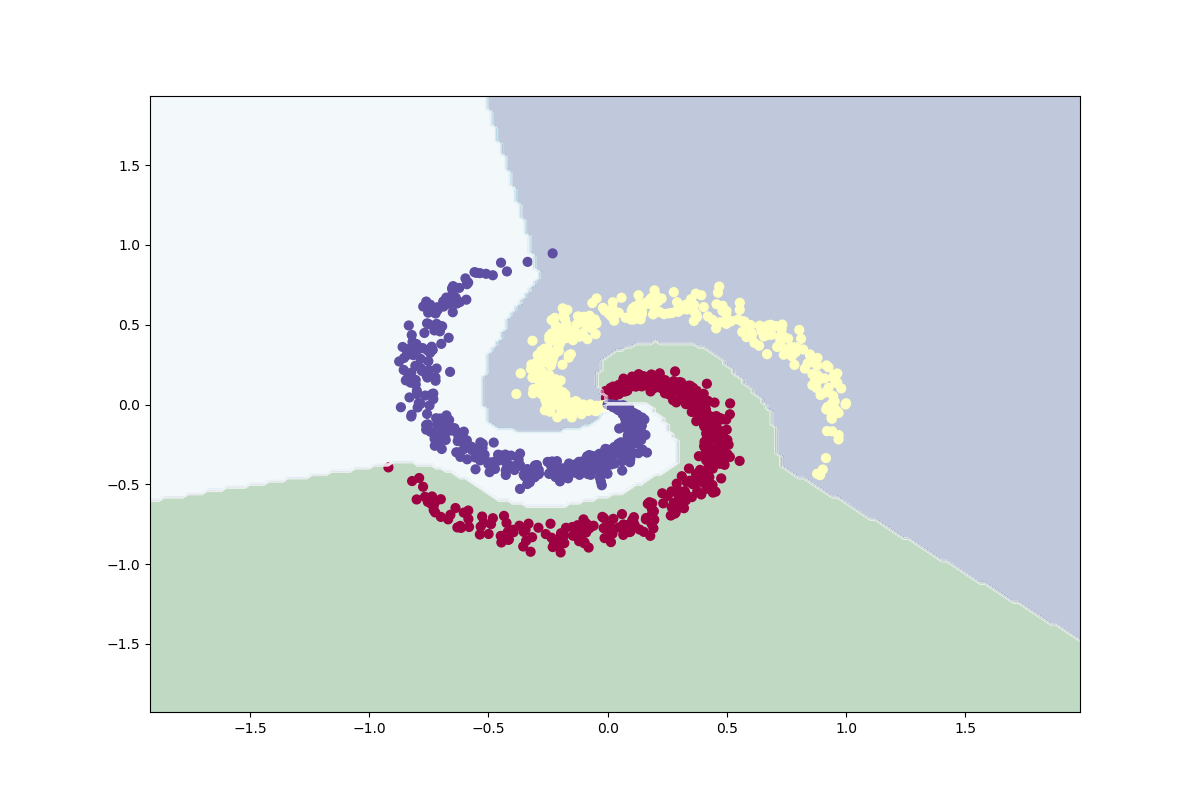
Keras Neural Network Classifier
I load and prepare the data set in the same way as before by splitting it into a training set and a test set, sets is still balanced after the split. A neural network model is built with keras functional API, it has one input layer, a hidden layer and an output layer. Keras functional API can be used to build very complex deep learning models with many layers. Training is evaluated on accuracy and the loss function is categorical crossentropy. The code and the evaluation output is shown below.
# Import libraries
import pandas
import numpy as np
import matplotlib.pyplot as plt
import sklearn.model_selection
import sklearn.metrics
import sklearn.preprocessing
import keras

# Train and evaluate
def train_and_evaluate(X_train, Y_train, X_test, Y_test):

    # Create layers (Functional API)
    inputs = keras.layers.Input(shape=(2,), dtype='float32', name='input_layer') # Input (2 dimensions)
    outputs = keras.layers.Dense(64, activation='relu', name='hidden_layer')(inputs) # Hidden layer
    outputs = keras.layers.Dense(3, activation='softmax', name='output_layer')(outputs) # Output layer (3 labels)

    # Create a model from input layer and output layers
    model = keras.models.Model(inputs=inputs, outputs=outputs, name='neural_network')

    # Compile the model (binary_crossentropy if 2 classes)
    model.compile(loss='categorical_crossentropy', optimizer='adam', metrics=['accuracy'])

    # Convert labels to categorical: categorical_crossentropy expects targets
    # to be binary matrices (1s and 0s) of shape (samples, classes)
    Y_binary = keras.utils.to_categorical(Y_train, num_classes=3, dtype='int')

    # Train the model on the train set (output debug information)
    model.fit(X_train, Y_binary, batch_size=1, epochs=100, verbose=1)

    # Save the model (Make sure that the folder exists)
    model.save('models\\keras_nn.h5')

    # Evaluate on training data
    print('\n-- Training data --')
    predictions = model.predict(X_train)
    accuracy = sklearn.metrics.accuracy_score(Y_train, np.argmax(predictions, axis=1))
    print('Accuracy: {0:.2f}'.format(accuracy * 100.0))
    print('Classification Report:')
    print(sklearn.metrics.classification_report(Y_train, np.argmax(predictions, axis=1)))
    print('Confusion Matrix:')
    print(sklearn.metrics.confusion_matrix(Y_train, np.argmax(predictions, axis=1)))
    print('')

    # Evaluate on test data
    print('\n---- Test data ----')
    predictions = model.predict(X_test)
    accuracy = sklearn.metrics.accuracy_score(Y_test, np.argmax(predictions, axis=1))
    print('Accuracy: {0:.2f}'.format(accuracy * 100.0))
    print('Classification Report:')
    print(sklearn.metrics.classification_report(Y_test, np.argmax(predictions, axis=1)))
    print('Confusion Matrix:')
    print(sklearn.metrics.confusion_matrix(Y_test, np.argmax(predictions, axis=1)))

# Plot the classifier
def plot_classifier(X, Y):

    # Load the model
    model = keras.models.load_model('models\\keras_nn.h5')

    # Plot model (Requires Graphviz)
    #keras.utils.plot_model(model, show_shapes=True, rankdir='LR', expand_nested=True, to_file='plots\\keras_nn_model.png')

    # Calculate
    h = 0.02
    x_min, x_max = X[:, 0].min() - 1, X[:, 0].max() + 1
    y_min, y_max = X[:, 1].min() - 1, X[:, 1].max() + 1
    xx, yy = np.meshgrid(np.arange(x_min, x_max, h), np.arange(y_min, y_max, h))

    # Make predictions
    Z = model.predict(np.c_[xx.ravel(), yy.ravel()])
    Z = np.argmax(Z, axis=1)
    Z = Z.reshape(xx.shape)

    # Plot diagram
    fig = plt.figure(figsize = (12, 8))
    plt.contourf(xx, yy, Z, cmap='ocean', alpha=0.25)
    plt.contour(xx, yy, Z, colors='w', linewidths=0.4)
    plt.scatter(X[:, 0], X[:, 1], c=Y, s=40, cmap='Spectral')
    plt.xlim(xx.min(), xx.max())
    plt.ylim(yy.min(), yy.max())
    plt.savefig('plots\\keras_nn_classifier.png')

# The main entry point for this module
def main():

    # Load data set (includes header values)
    dataset = pandas.read_csv('files\\spirals.csv')

    # Slice data set in data and labels (2D-array)
    X = dataset.values[:,0:2].astype(float) # Data
    Y = dataset.values[:,2].astype(int) # Labels

    # Split data set in train and test (use random state to get the same split every time, and stratify to keep balance)
    X_train, X_test, Y_train, Y_test = sklearn.model_selection.train_test_split(X, Y, test_size=0.2, random_state=5, stratify=Y)

    # Make sure that data still is balanced
    print('\n--- Class balance ---')
    print(np.unique(Y_train, return_counts=True))
    print(np.unique(Y_test, return_counts=True))

    # Train and evaluate
    train_and_evaluate(X_train, Y_train, X_test, Y_test)

    # Plot classifier
    plot_classifier(X, Y)

# Tell python to run main method
if __name__ == "__main__": main()
--- Class balance ---
(array([0, 1, 2]), array([320, 320, 320], dtype=int64))
(array([0, 1, 2]), array([80, 80, 80], dtype=int64))
-- Training data --
Accuracy: 99.69
Classification Report:
precision recall f1-score support
0 1.00 0.99 1.00 320
1 1.00 1.00 1.00 320
2 0.99 1.00 1.00 320
accuracy 1.00 960
macro avg 1.00 1.00 1.00 960
weighted avg 1.00 1.00 1.00 960
Confusion Matrix:
[[318 0 2]
[ 0 319 1]
[ 0 0 320]]
---- Test data ----
Accuracy: 99.58
Classification Report:
precision recall f1-score support
0 1.00 1.00 1.00 80
1 0.99 1.00 0.99 80
2 1.00 0.99 0.99 80
accuracy 1.00 240
macro avg 1.00 1.00 1.00 240
weighted avg 1.00 1.00 1.00 240
Confusion Matrix:
[[80 0 0]
[ 0 80 0]
[ 0 1 79]]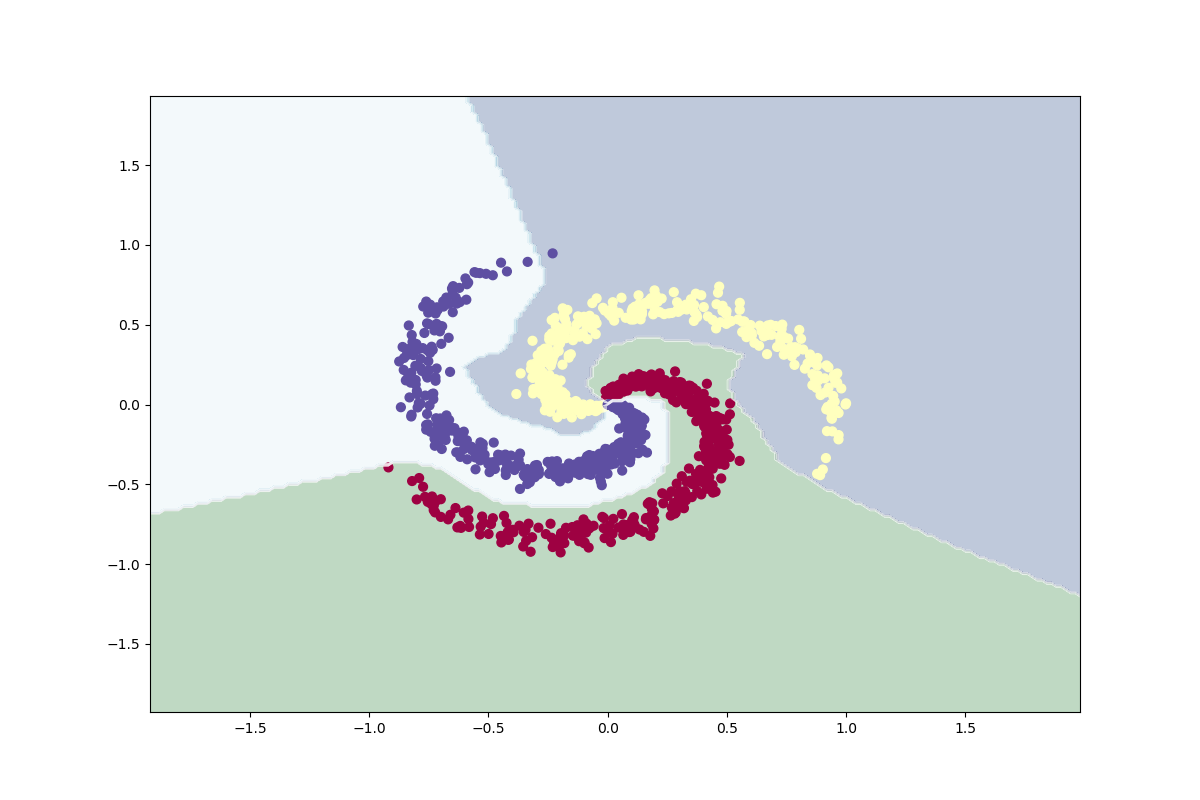
keras is not working for me
Hi, thank you for your comment. Do you get any error message/messages?
Hi! I’m looking for a classification program for medical diagnoses. (eg diagnosis and classification of eye diseases). I need your advice I don’t know where to start.
thank you, it is very helpful. but i got error “ValueError: Error when checking input: expected input_layer to have shape (28,) but got array with shape (2,)” could you please help?
I have 28 input features and 6 output classes.
Hi!
Change the shape on the input layer to (28,):
# Create layers (Functional API) inputs = keras.layers.Input(shape=(28,), dtype='float32', name='input_layer') # Input (2 dimensions)thank you for your reply. I have six output classes. but I got an error message
“categorical[np.arange(n), y] = 1
IndexError: index 6 is out of bounds for axis 1 with size 6”
could you please help me how to debug it?
Hi!
Have you set 6 on the output layer and converted y-labels to a matrix? Number of classes should be 6 in your case.
# Convert labels to categorical: categorical_crossentropy expects targets # to be binary matrices (1s and 0s) of shape (samples, classes) Y_binary = keras.utils.to_categorical(Y_train, num_classes=6, dtype='int')very clear and helpful. awesome.